Advanced Dashboard
If there is only one page you read in this entire documentation, let it be this one. The Advanced Dashboard is the nerve center of your PaaS.sh experience—it is where you will spend the majority of your time performing operations, managing deployments, and working your magic.
Through this dashboard, you gain absolute control over your project and its associated branches. Because this guide covers a comprehensive suite of powerful tools, it may seem long. We highly recommend taking it at your own pace or using this page as your primary reference manual whenever you need to dive into a specific feature.
Overview
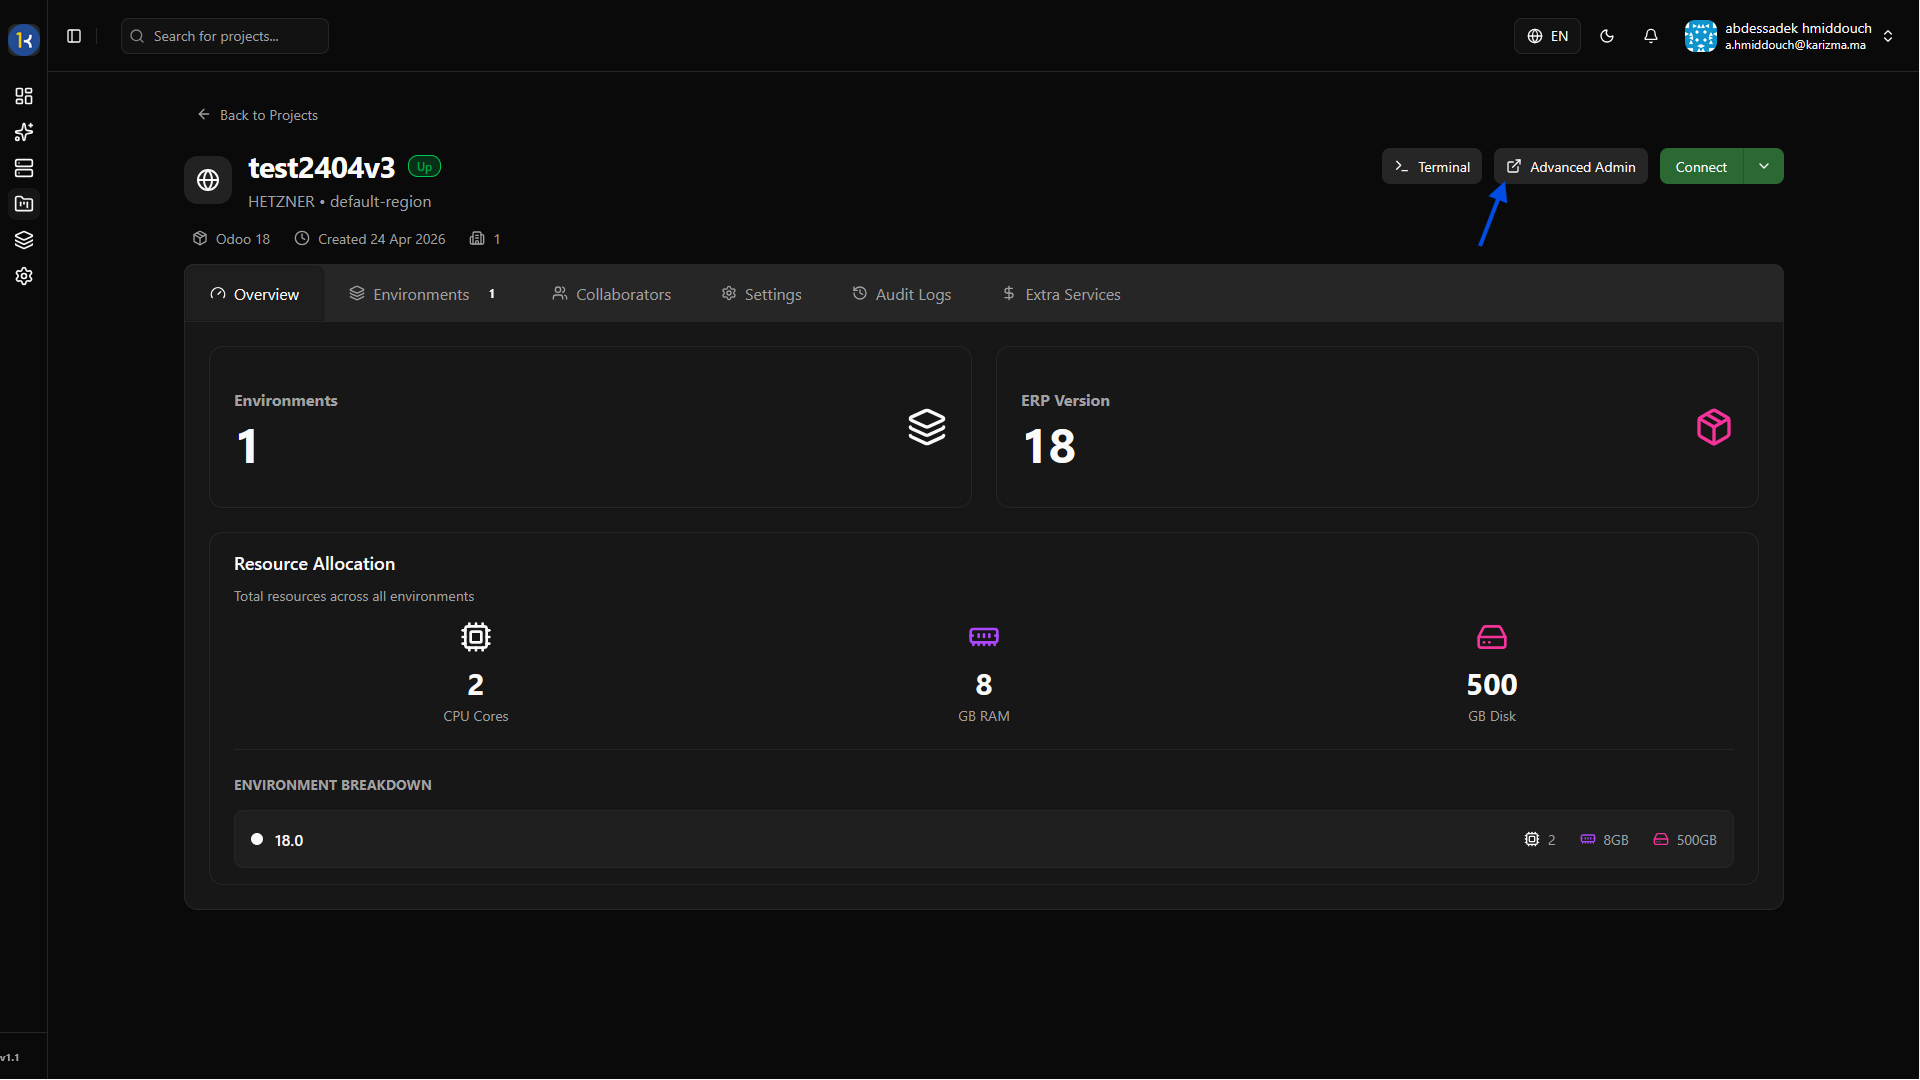
To access the Advanced Dashboard, simply navigate to your project and click the Advanced Dashboard button.
Once inside, you will see a comprehensive view of your branch environments and their controls.
Toolbar Actions
Each branch operates within its own fully isolated containerized environment. The top toolbar gives you direct control over the lifecycle and codebase of these environments.
Stop
Temporarily Stop a running environment to conserve server resources when the branch is not actively being used or tested. This is especially useful for older development branches.
Delete
Use Delete to permanently remove an environment and its associated data when a branch is fully merged or no longer needed.
Restart
The Restart action gracefully reboots the underlying containers. This is often required after manually changing core configuration variables or installing heavy third-party Python dependencies.
Connect
Clicking Connect securely routes you to the live frontend of your Odoo instance for that specific branch. This allows you to interact with the application exactly as your users would.
Web IDE
Forget about pulling code locally for minor changes. The Web IDE provides a fully-featured, VS Code-style editor directly in your browser. You can navigate your custom addons directory, edit XML views or Python models, and save your changes to trigger an automatic hot-reload of your environment.
Submodules
Manage your external Git dependencies directly from the dashboard. The Submodules tool allows you to link and update third-party Odoo addons seamlessly within your environment.
Clone
While a fork duplicates the database, a Clone simply copies the environment configuration and codebase to spin up a fresh instance with an empty, newly initialized Odoo database.
Fork
Forking an environment creates an exact, independent replica of both the codebase and the current database state. This is perfect for testing a risky database migration without affecting the original branch.
Merge Request
Initiate a Merge Request directly from the dashboard to propose integrating your current development branch into staging, or staging into production, triggering your automated CI/CD pipeline.
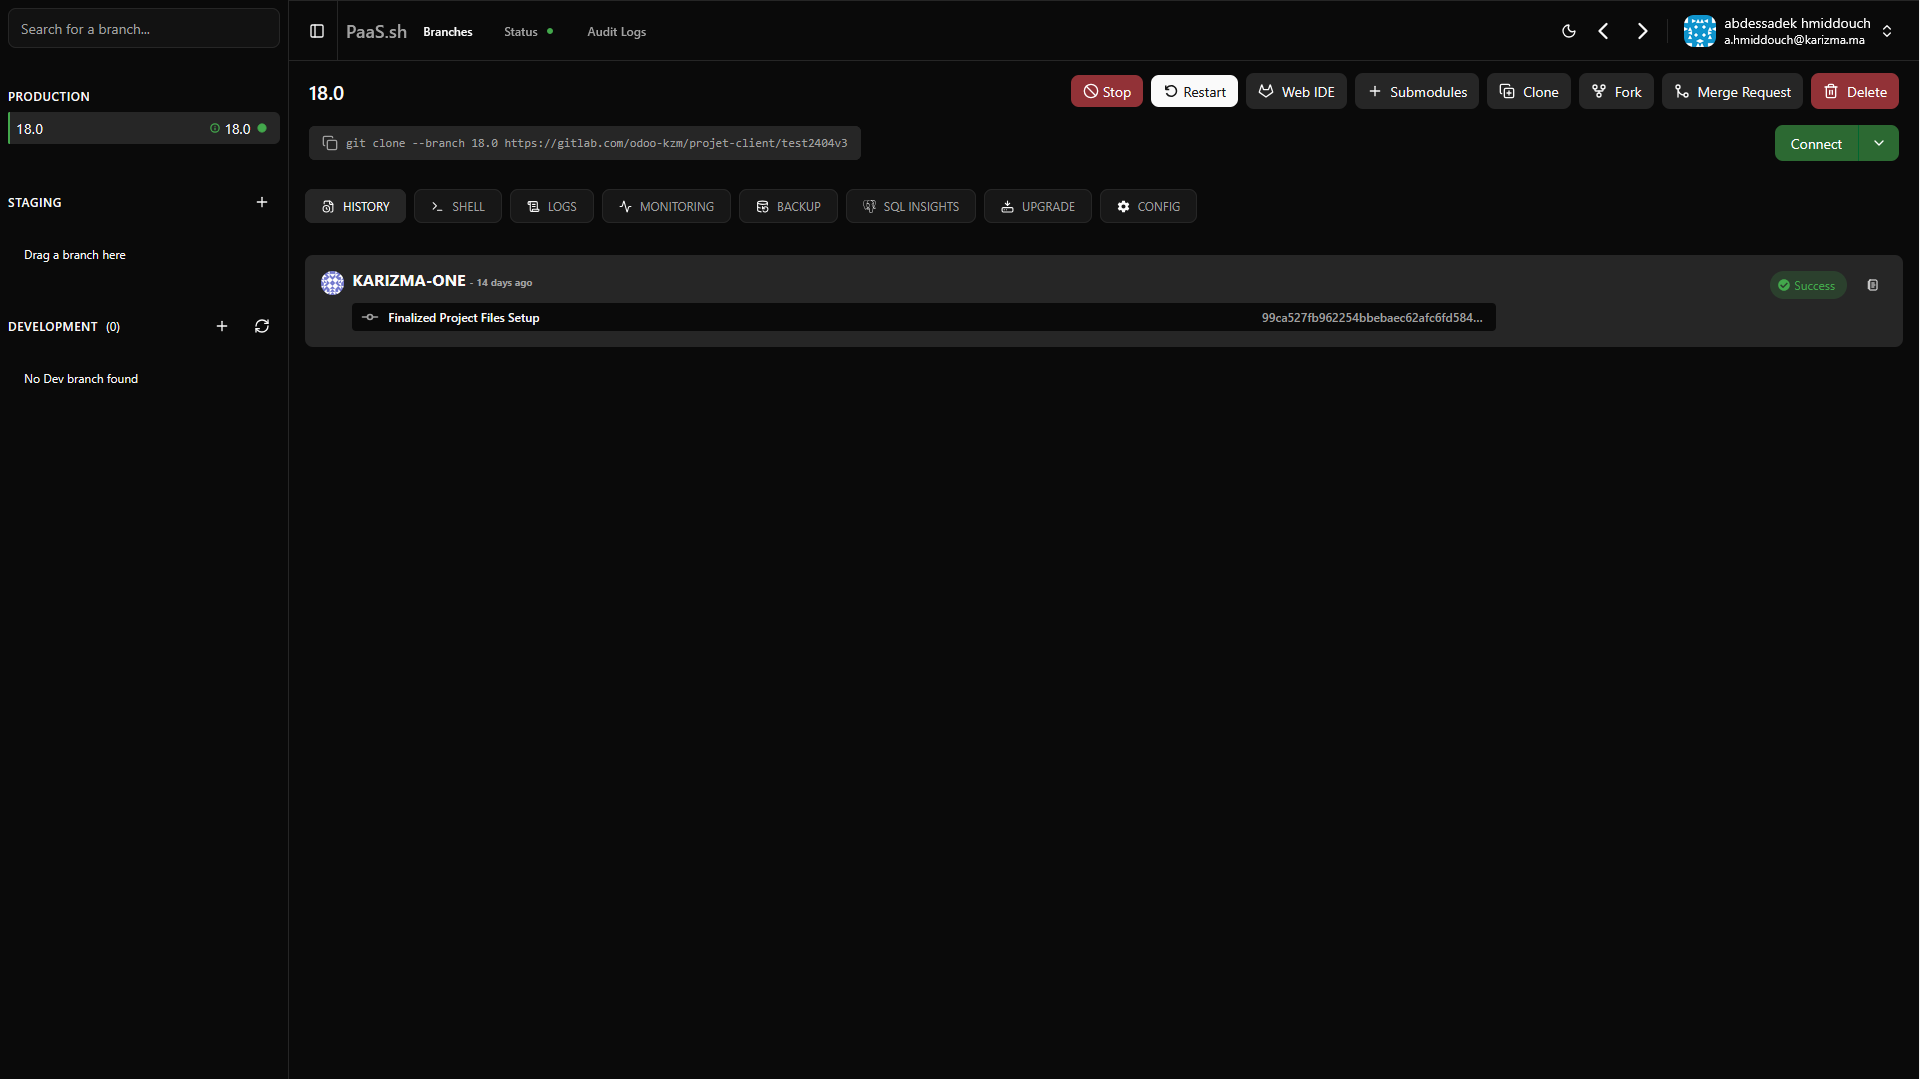
History
The History tab acts as your deployment audit log. It tracks every Git commit pushed to the branch, along with the detailed build status (Success, Failed, Pending). If a deployment fails, you can expand the history record to see exactly which step caused the error.
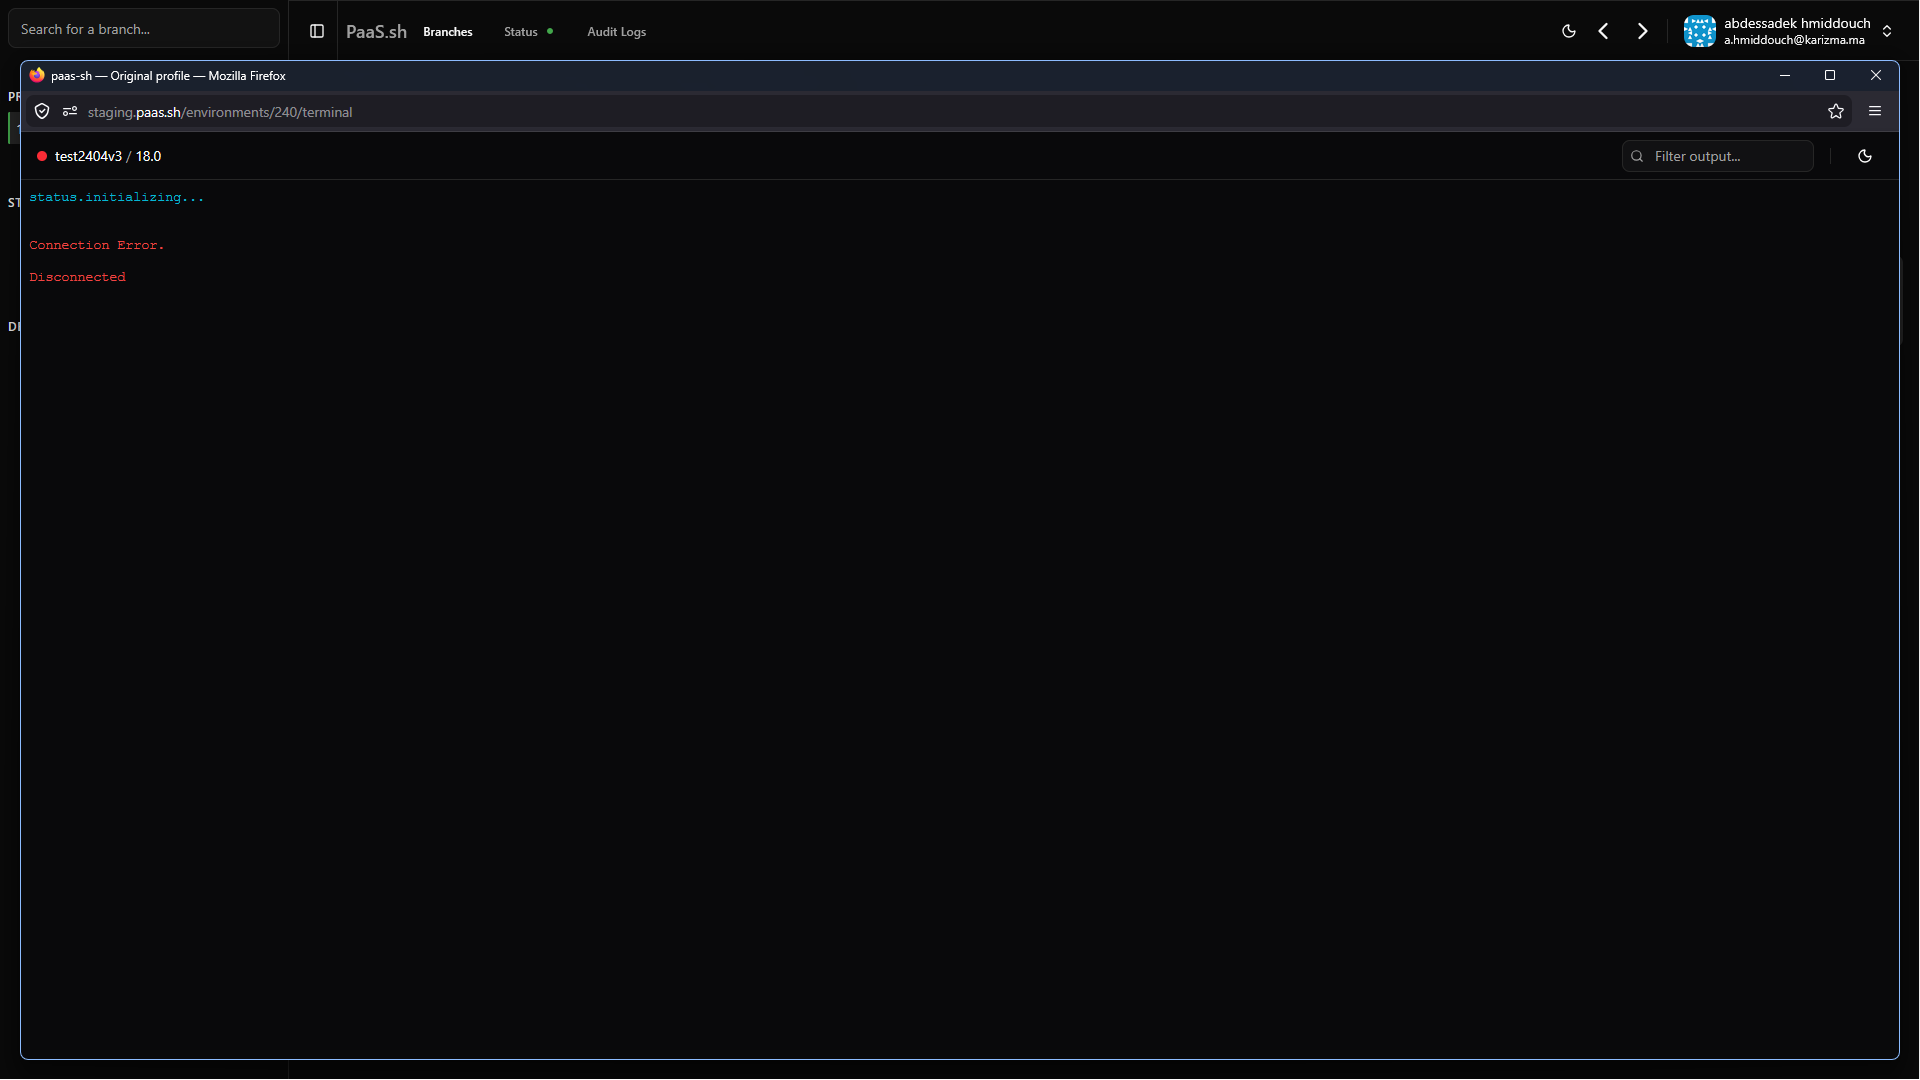
Shell
Need to run an odoo-bin command or check file permissions? The Shell feature drops you directly into a secure, browser-based terminal connected to your environment's Docker container.
If you are unable to view the Shell or see an access error message instead of the terminal interface, it is likely because your account lacks the necessary permissions to access the container's shell environment. Please contact your organization administrator if you require this access.
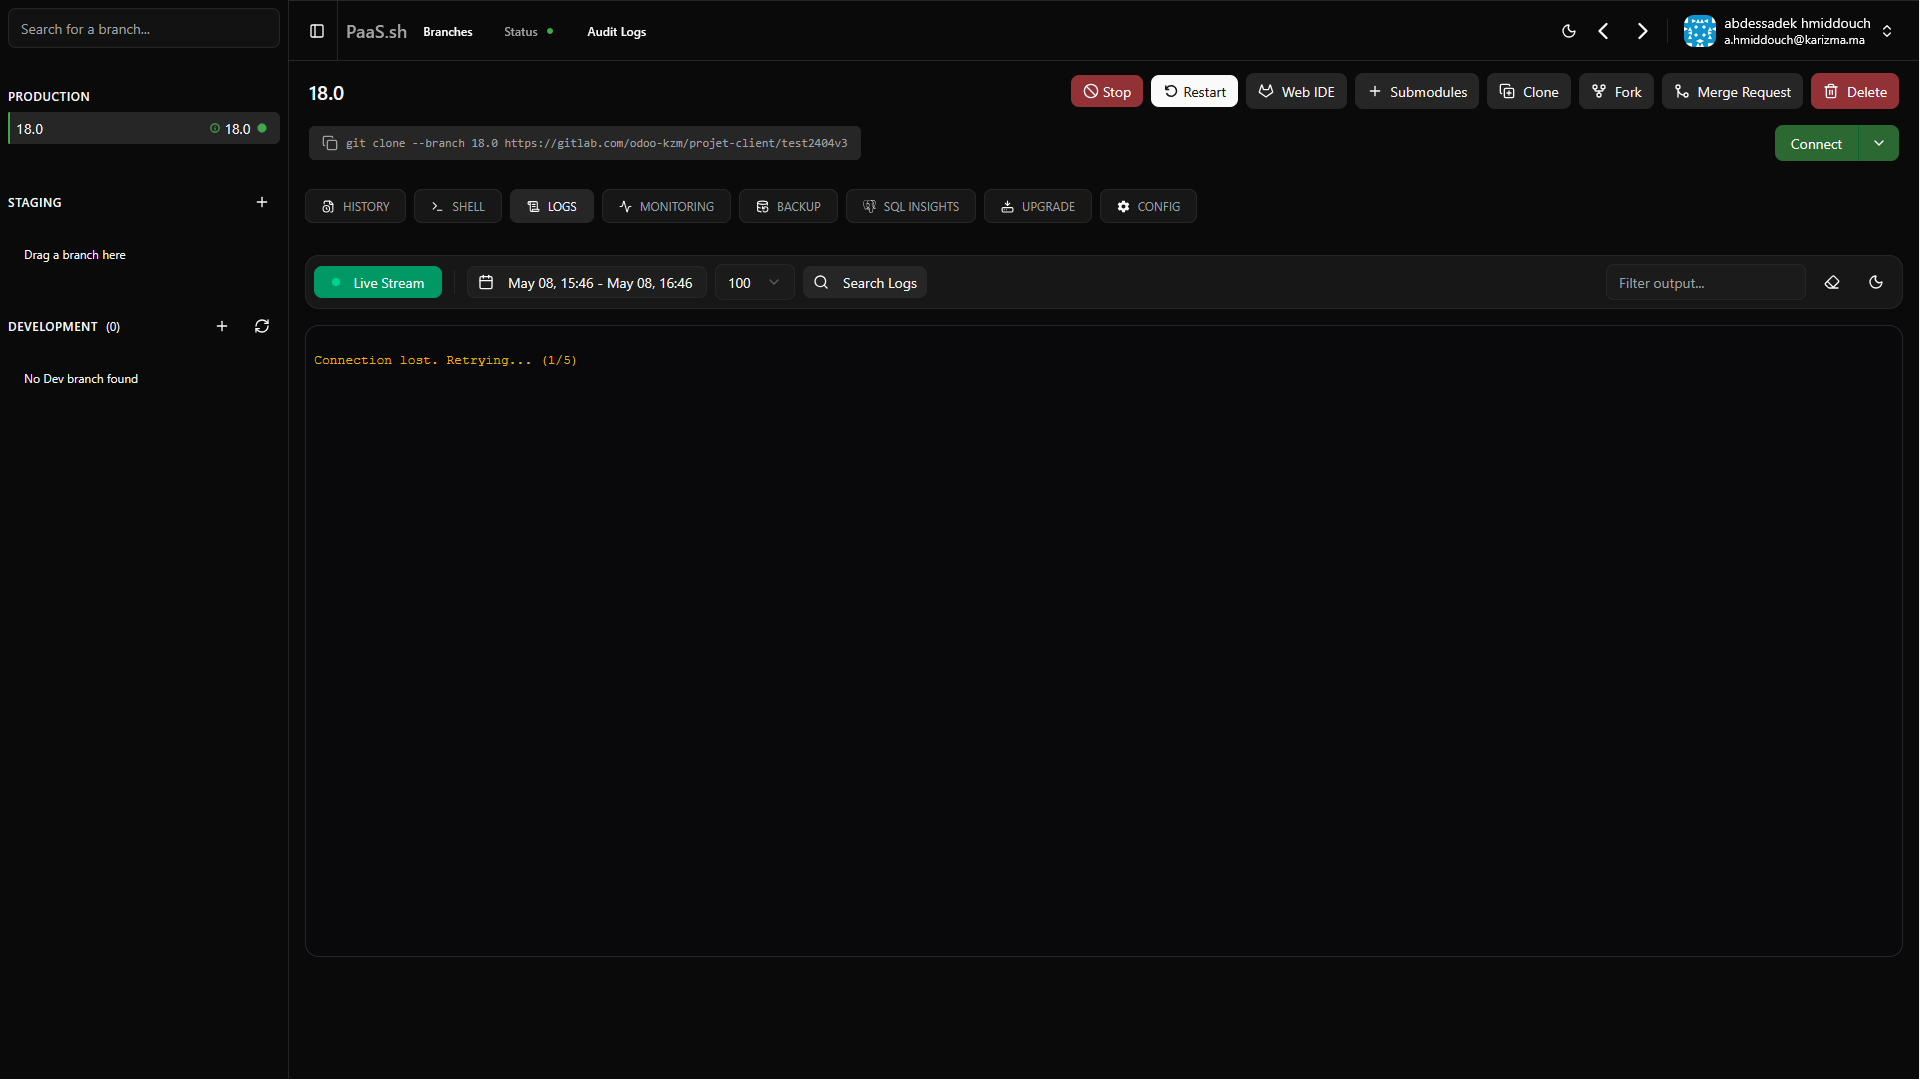
Logs
Troubleshooting starts here. The Logs viewer aggregates real-time output from your Odoo server, PostgreSQL database, and system-level deployment processes. You can filter by error severity or search for specific tracebacks.
Similar to the Shell feature, reading environment logs requires specific access rights. If you see an error or cannot view the logs, ensure you have the appropriate developer or administrator permissions assigned to your role.
Backups
Protecting your data is built directly into the dashboard. As we discussed in the Getting Started guide, data security is critical. Here, you have granular control over both manual and automated backups for your specific project environments.
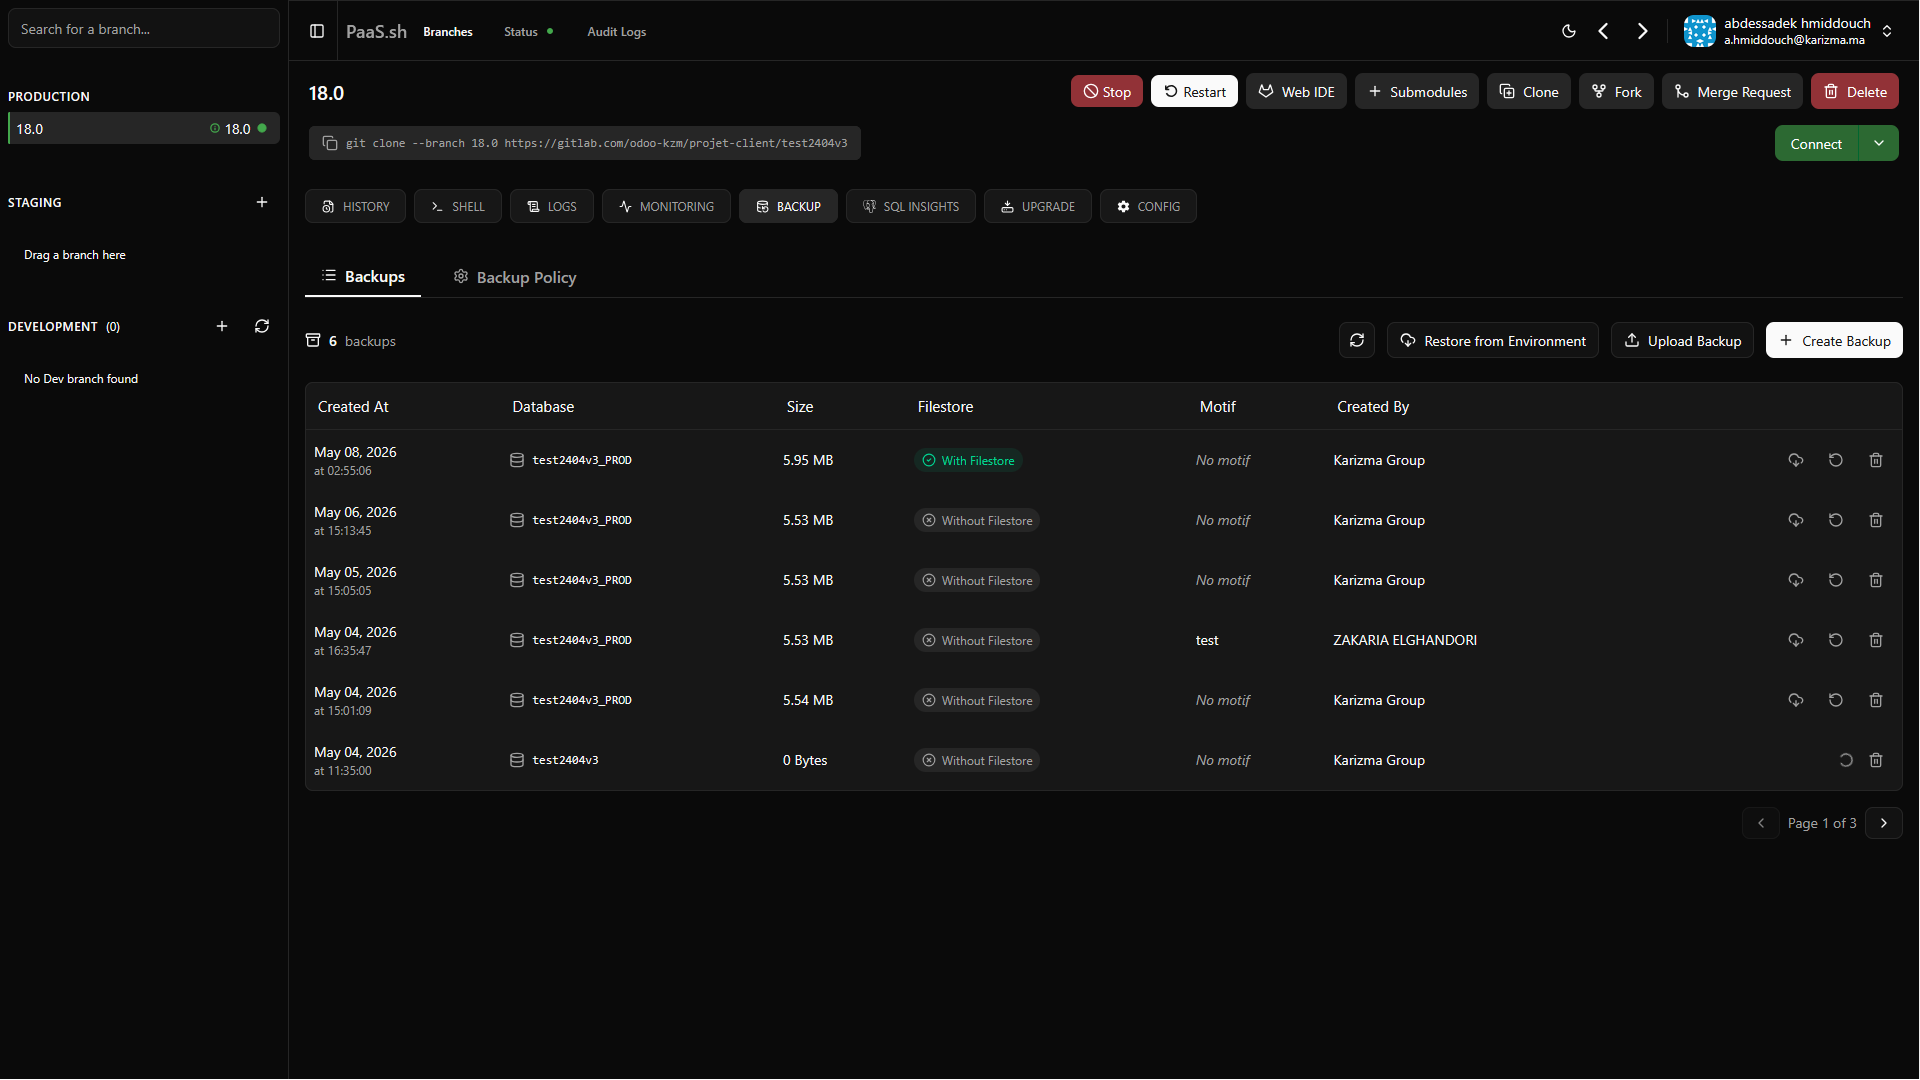
Backup List (Manual Creation)
With a single click, the Backup Creation tool generates an immediate, manual snapshot of your PostgreSQL database and filestore. The system compresses it into a downloadable .zip file, and you can view all past manual backups in this list.
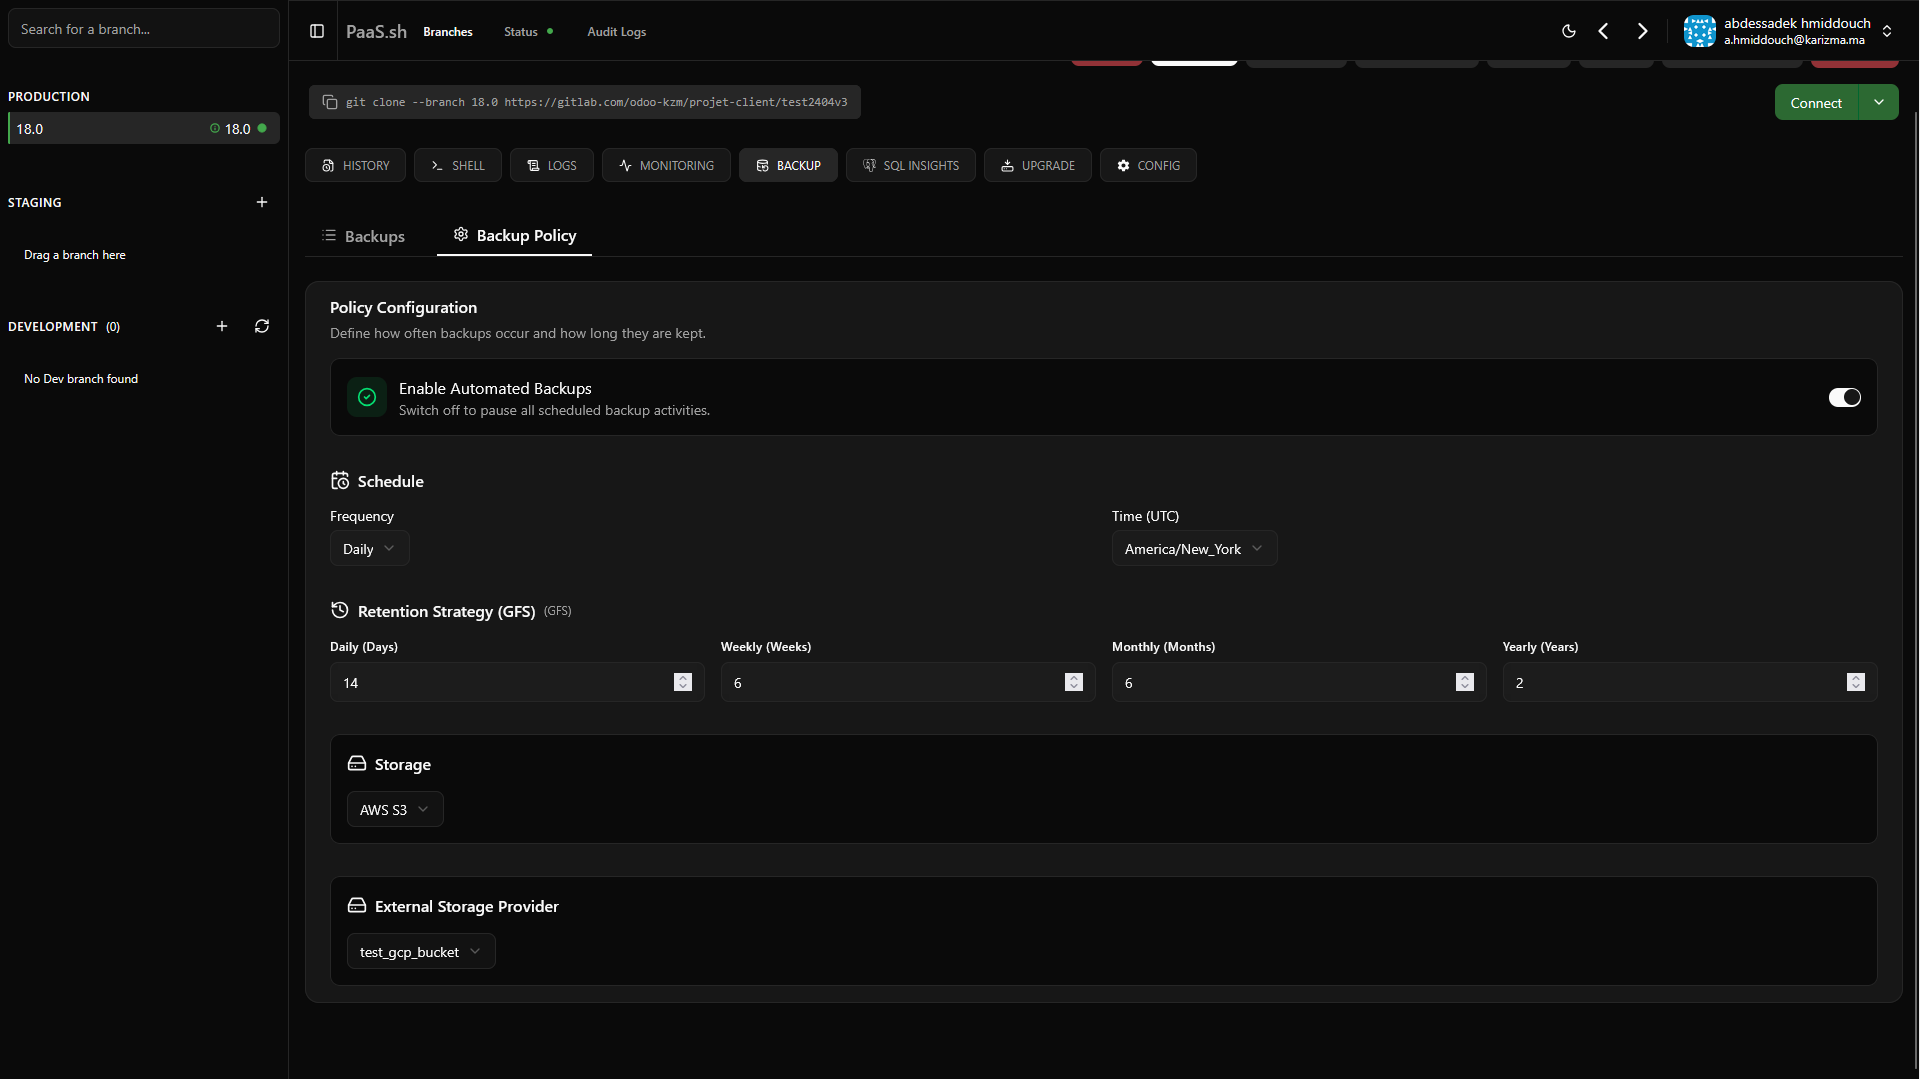
Project Backup Policies
Define your retention rules under Backup Policies. You can configure the system to automatically take daily snapshots at midnight and retain them for a set period, ensuring you always have a rollback point.
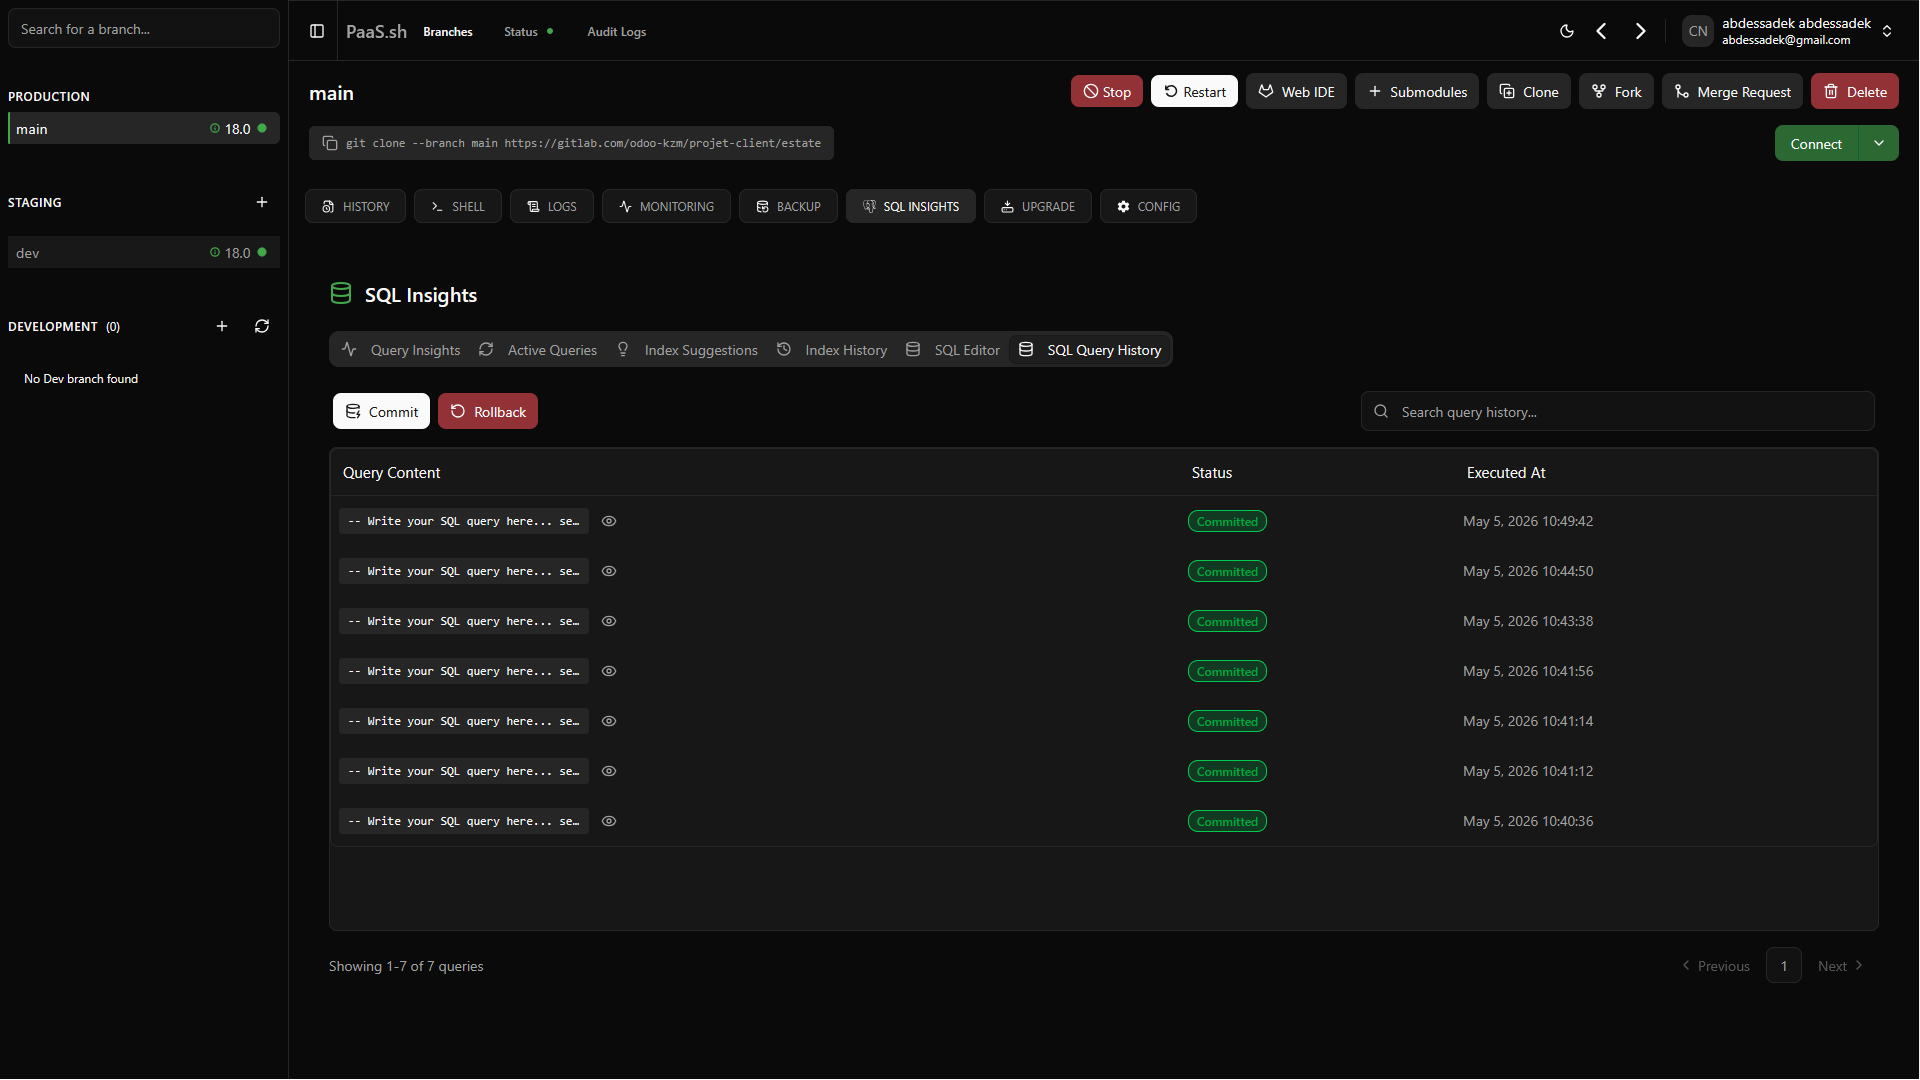
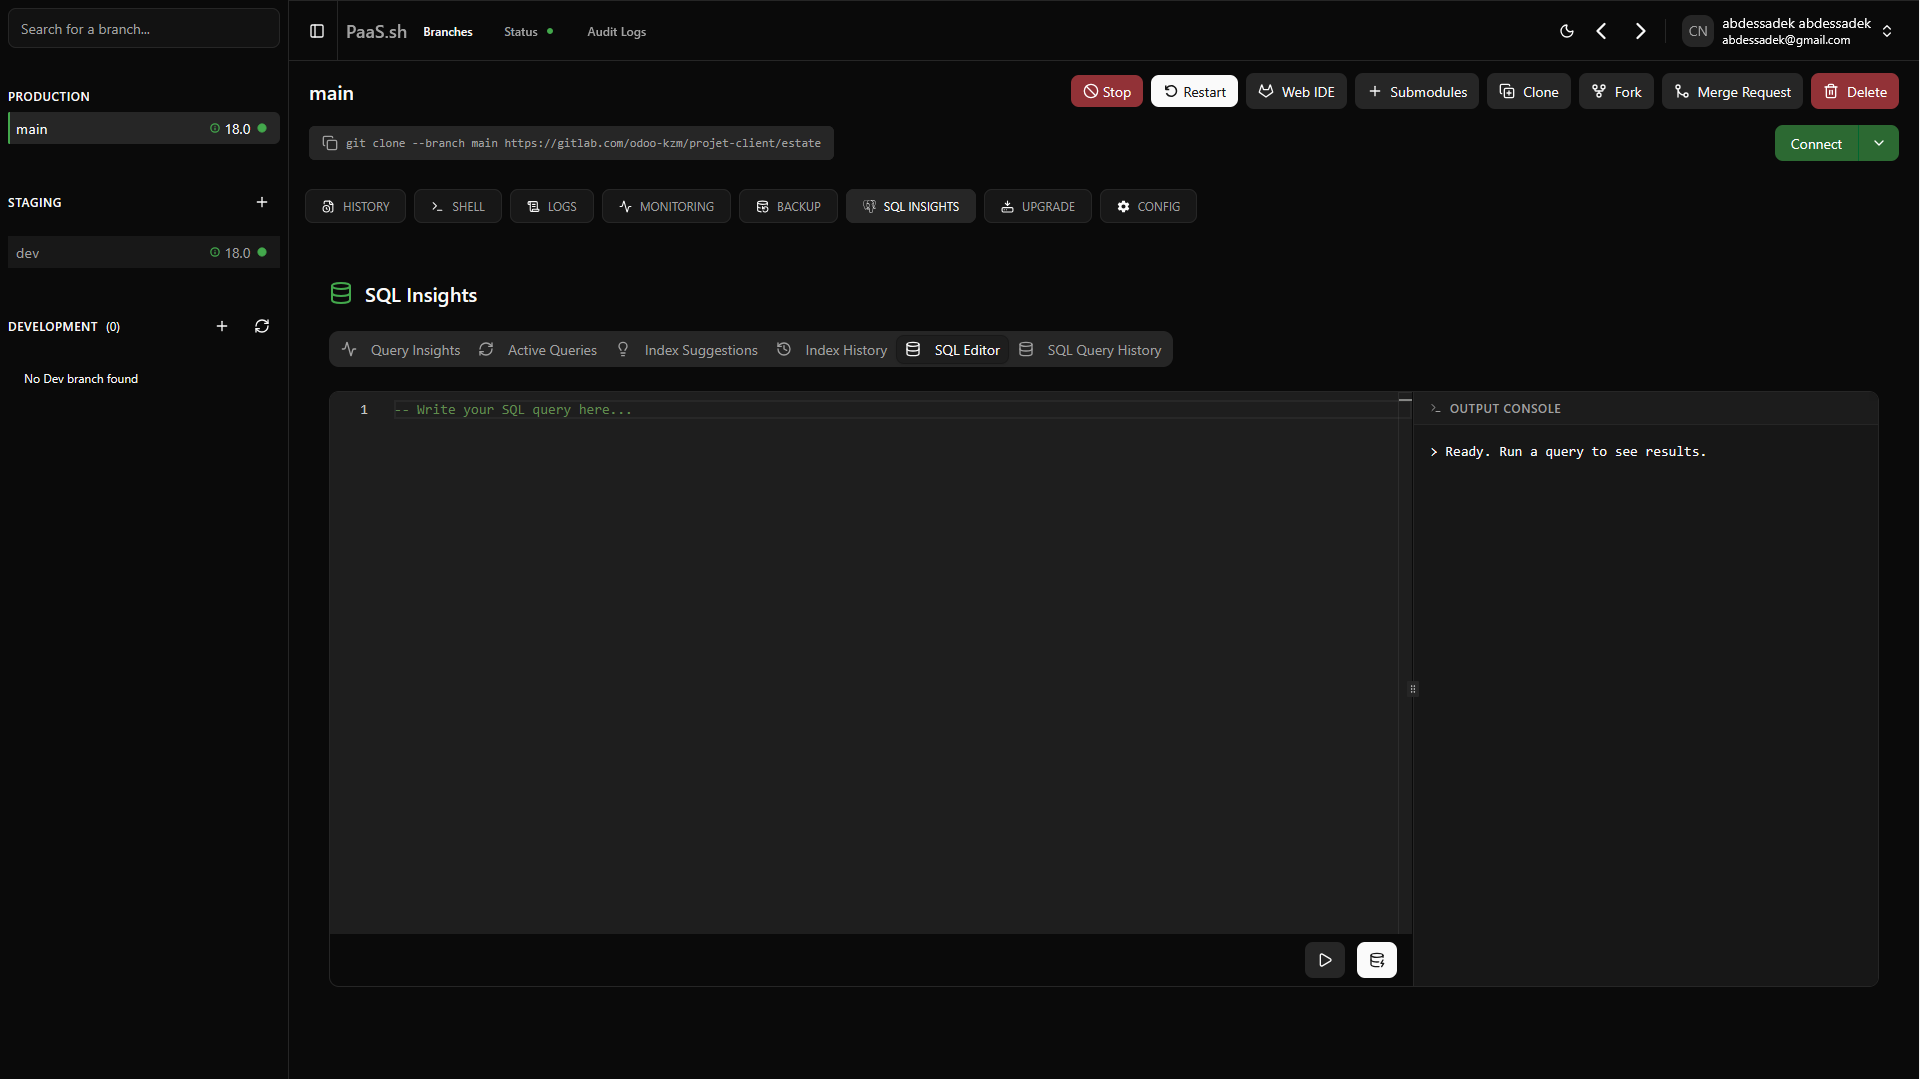
SQL Insights
As we have emphasized many times, data is the most critical asset for any ERP or information system. Think of SQL Insights as your personal datalab. It is a powerful suite where you can monitor queries, manage indexes, track database history, and even execute raw SQL queries directly from PaaS.sh—all without needing SSH access or third-party database tools. It also gives you full transaction control, allowing you to decide exactly when to commit changes.
Depending on your server's infrastructure provider, the tools available in this section are categorized into two groups:
- Available for All Providers (e.g., Hetzner, OVH, GCP, BYOS): Active Queries, SQL Editor, SQL History.
- Exclusive to GCP (Google Cloud Platform): Query Insights, Index Suggestions, Index History.
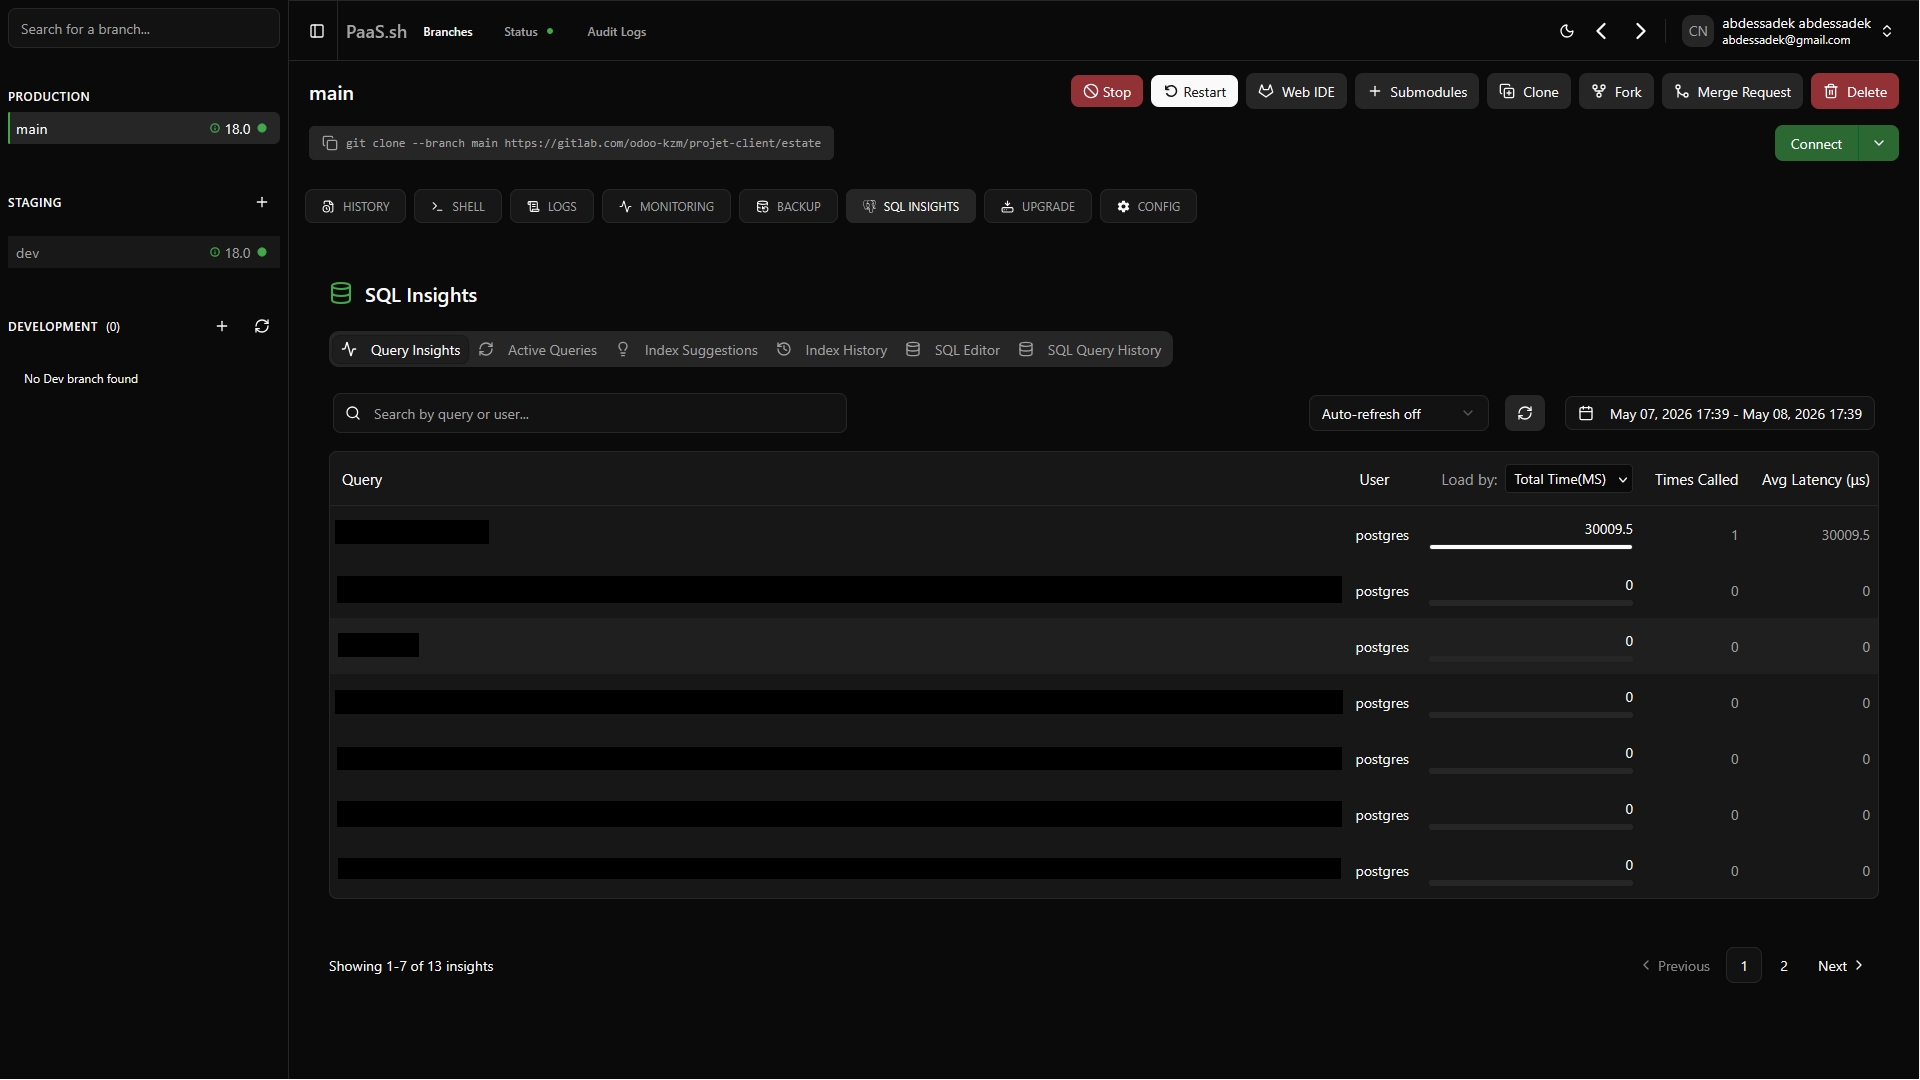
As you can see in these two images, the first is for a project deployed on Hetzner (all support), while the second is for a project deployed on GCP unlocking the additional tabs.
Query Insights (GCP Only)
Triggering large queries is too critical for managing your database health. In Query Insights, we are showing the largest queries by time. You can easily filter by the specific time period you want to see to isolate performance bottlenecks.
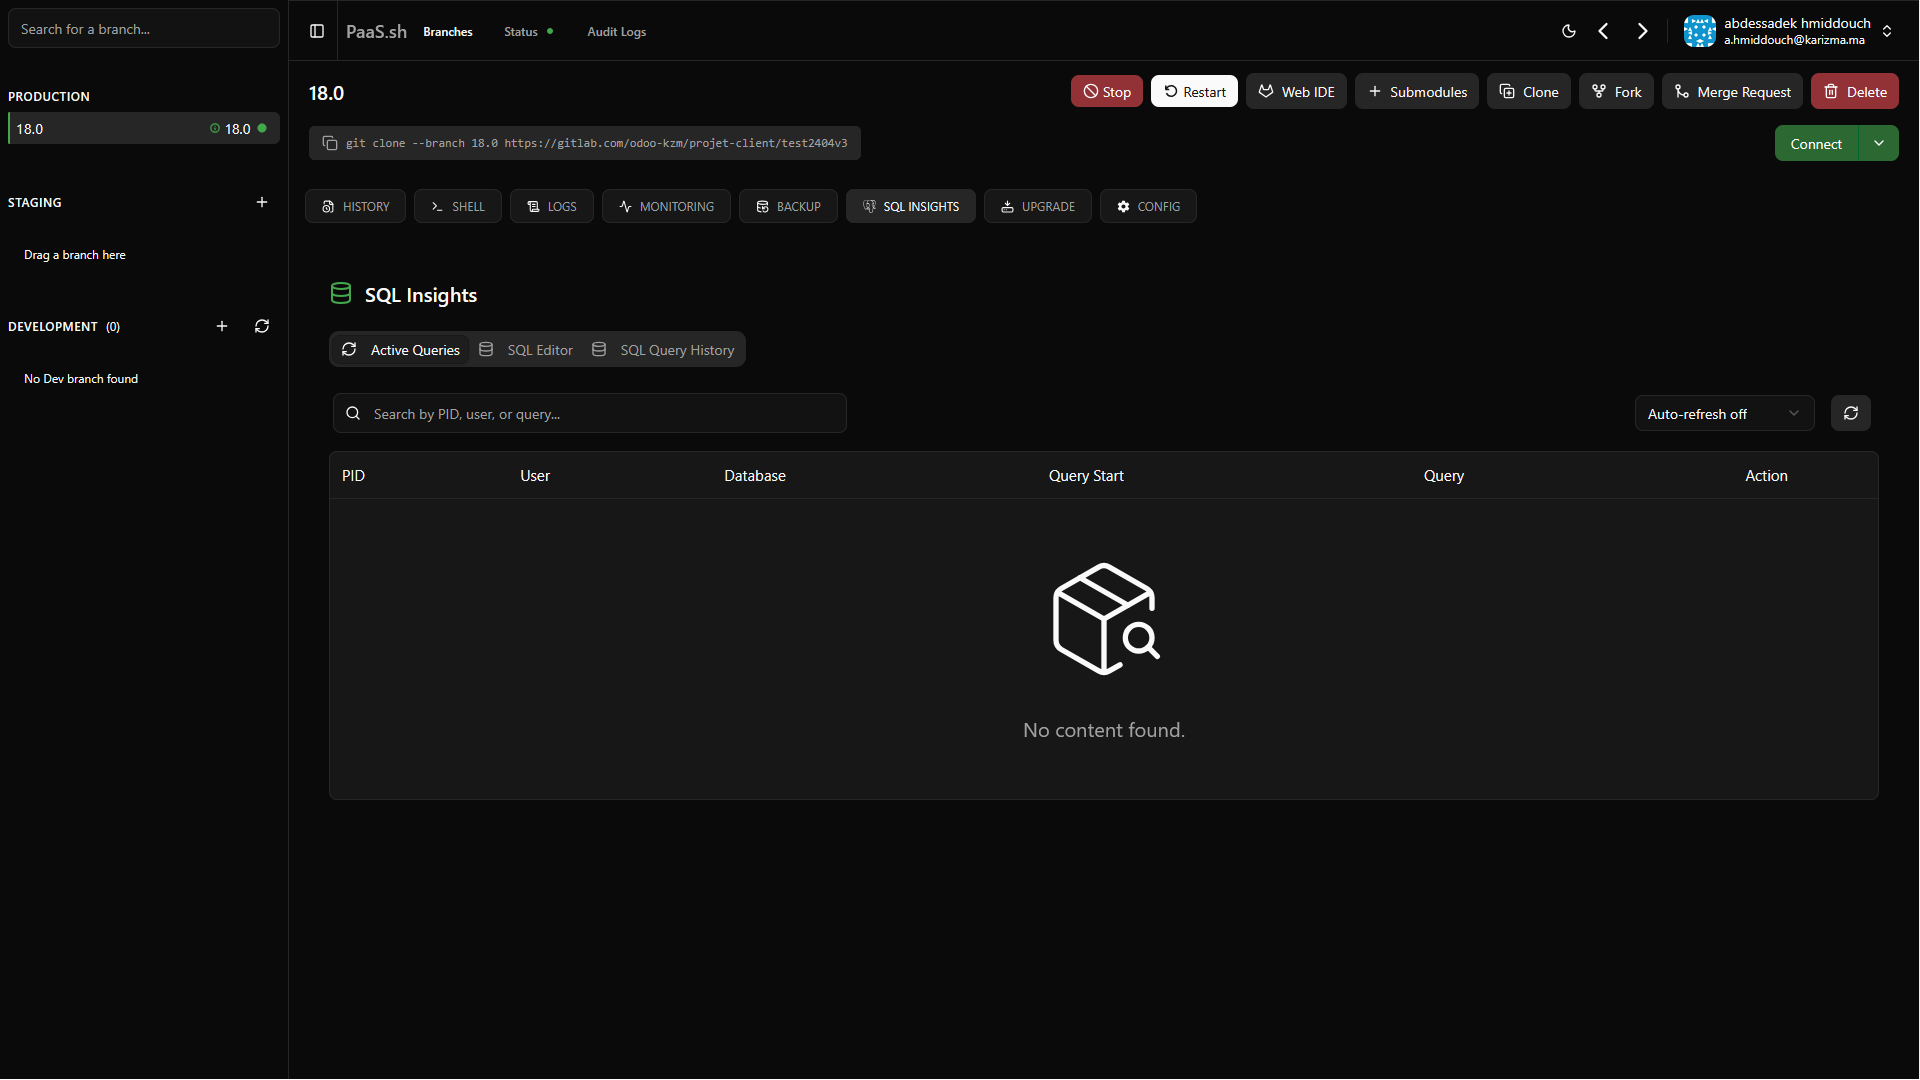
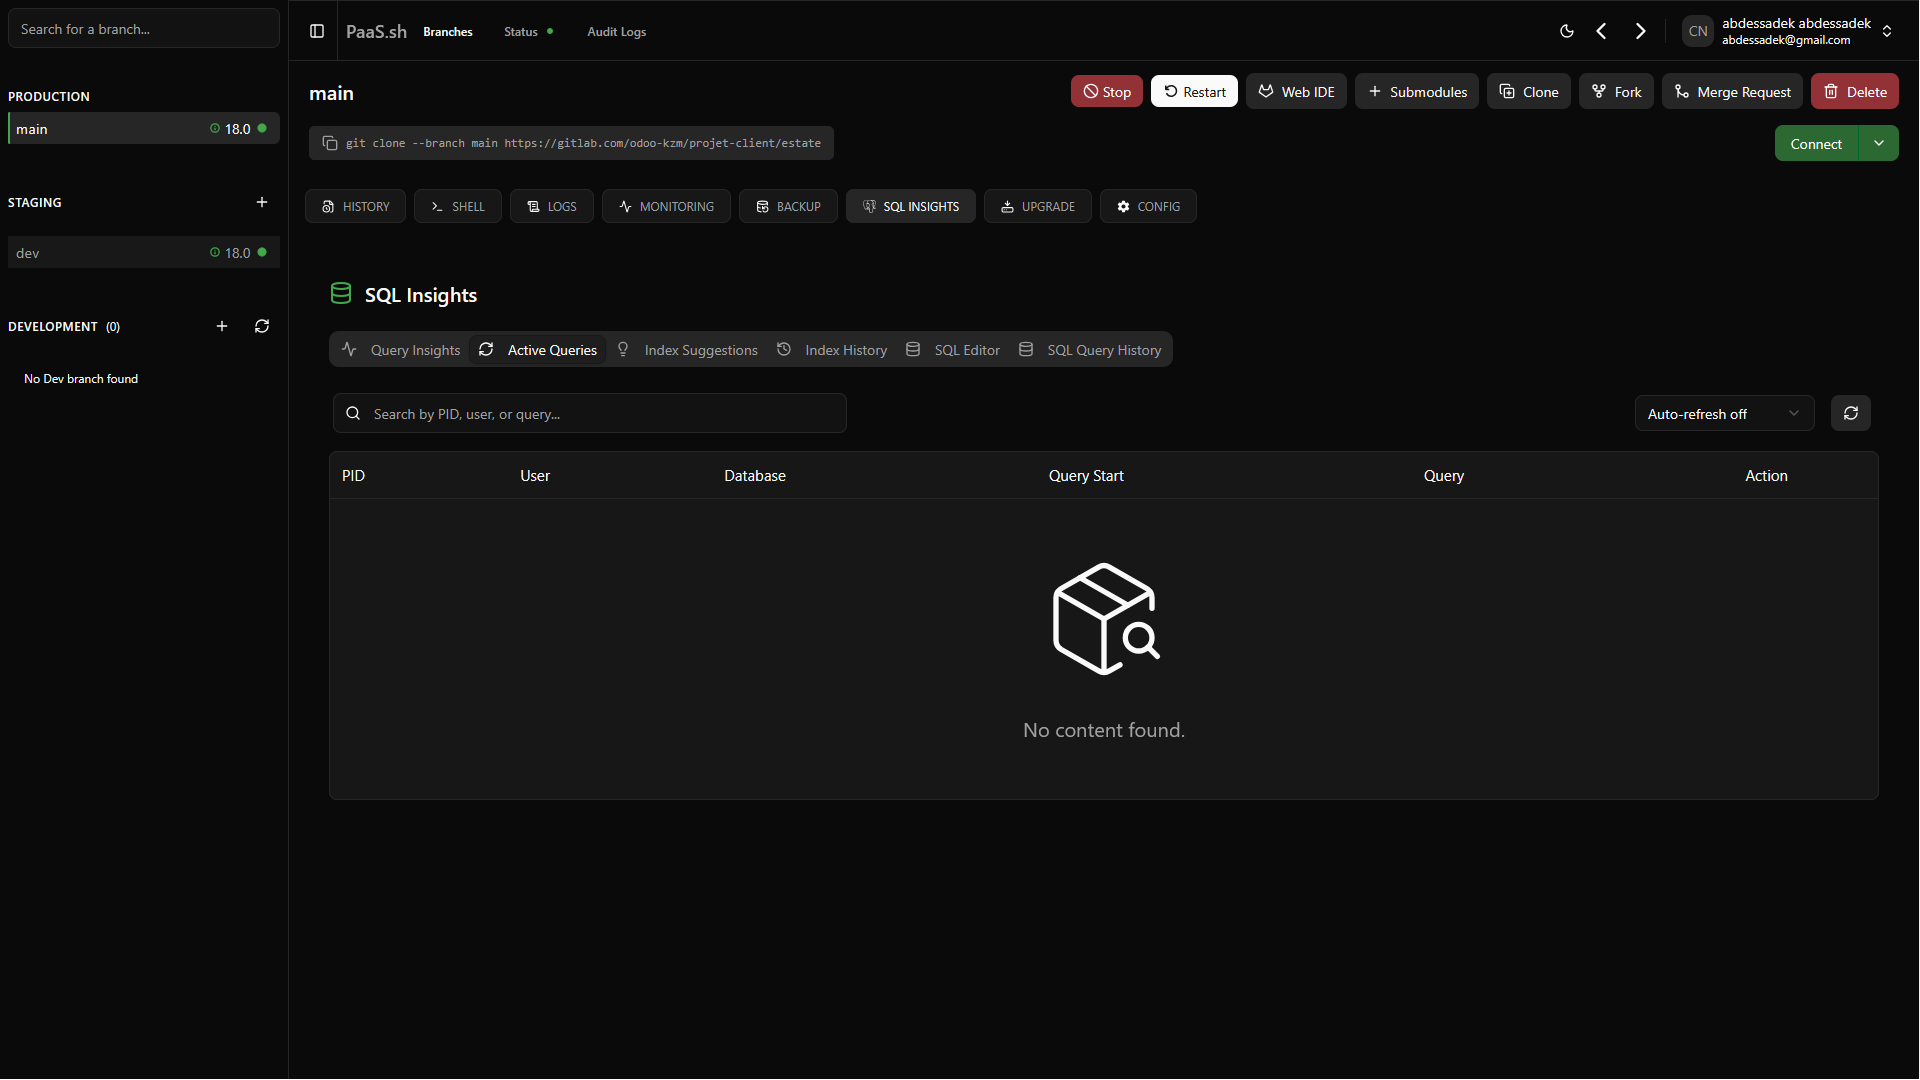
Active Queries (All Providers)
This table shows up queries that are currently running in your database at this very moment. This is incredibly useful for instantly identifying locked rows or stuck transactions.
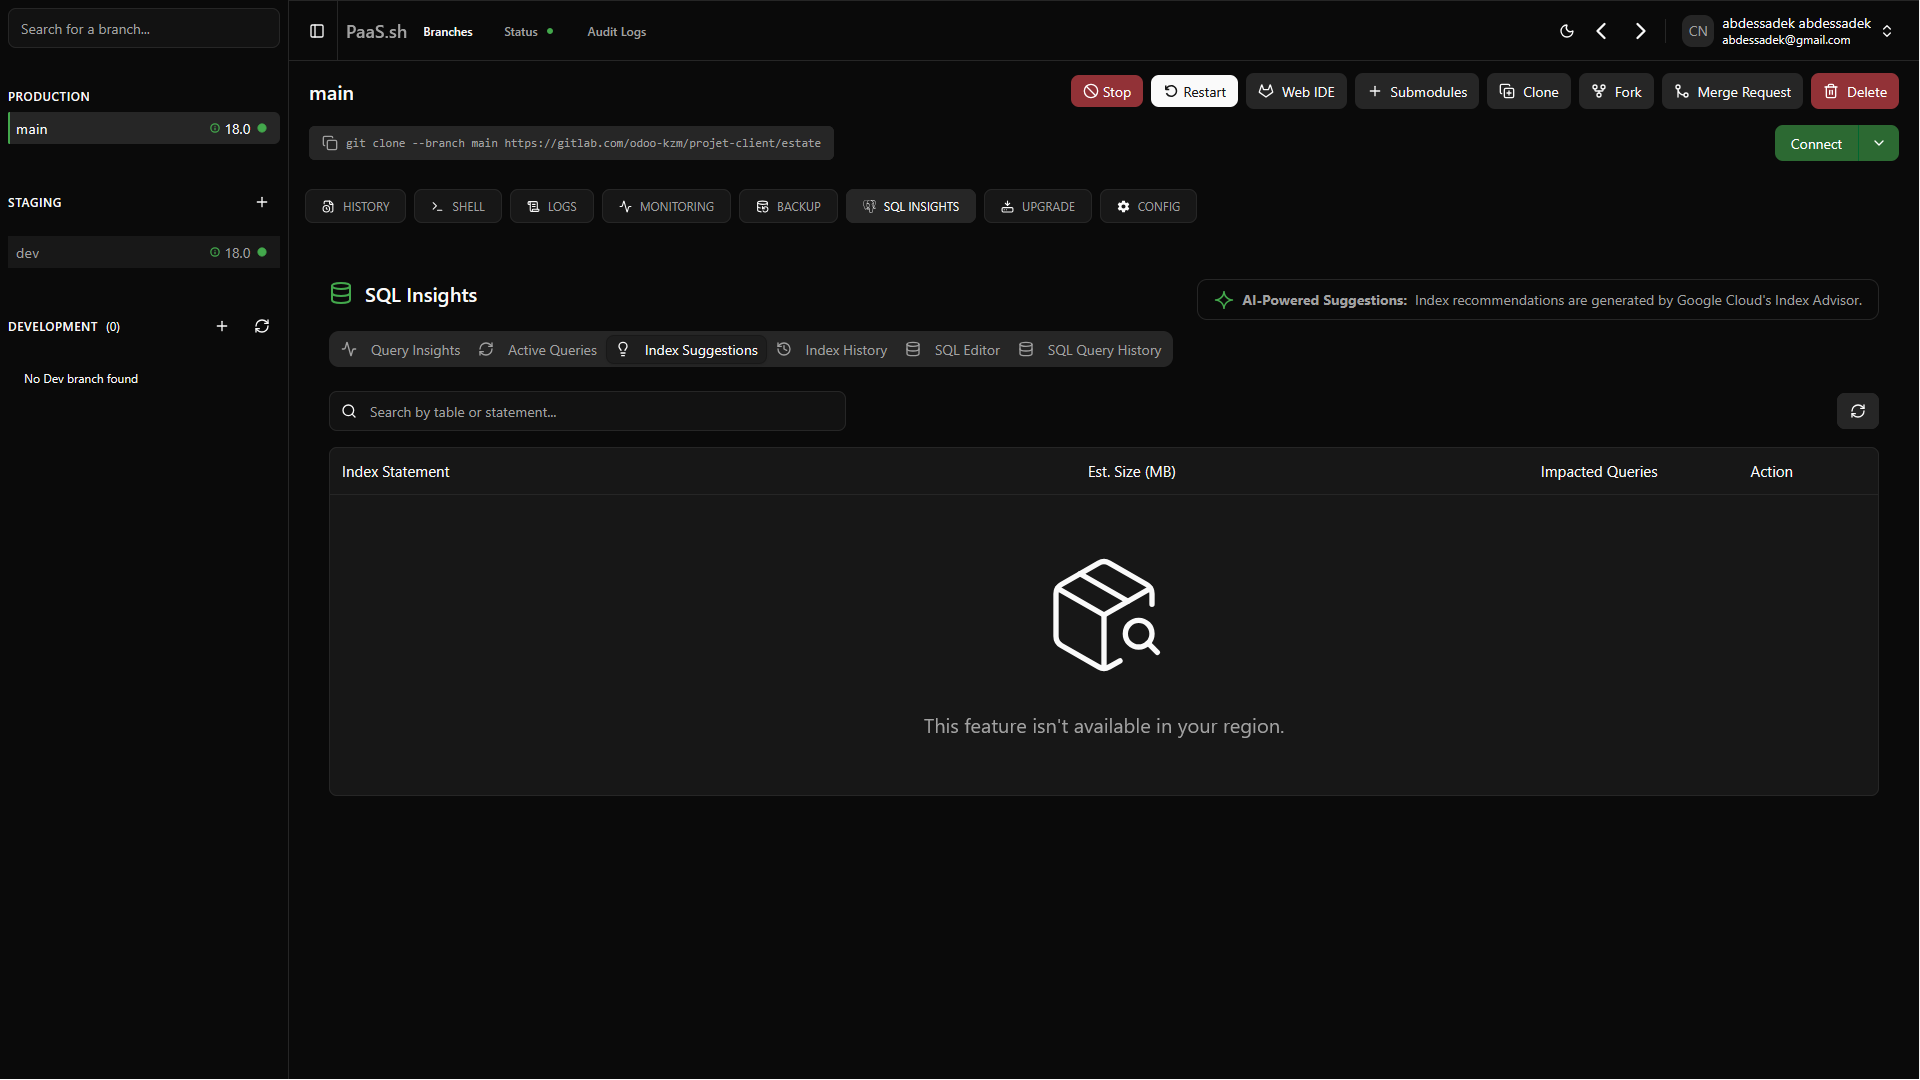
Index Suggestions (GCP Only)
Based on a continuous analysis of your database traffic and read patterns, the platform automatically generates Index Suggestions. Applying these can drastically reduce query execution times.
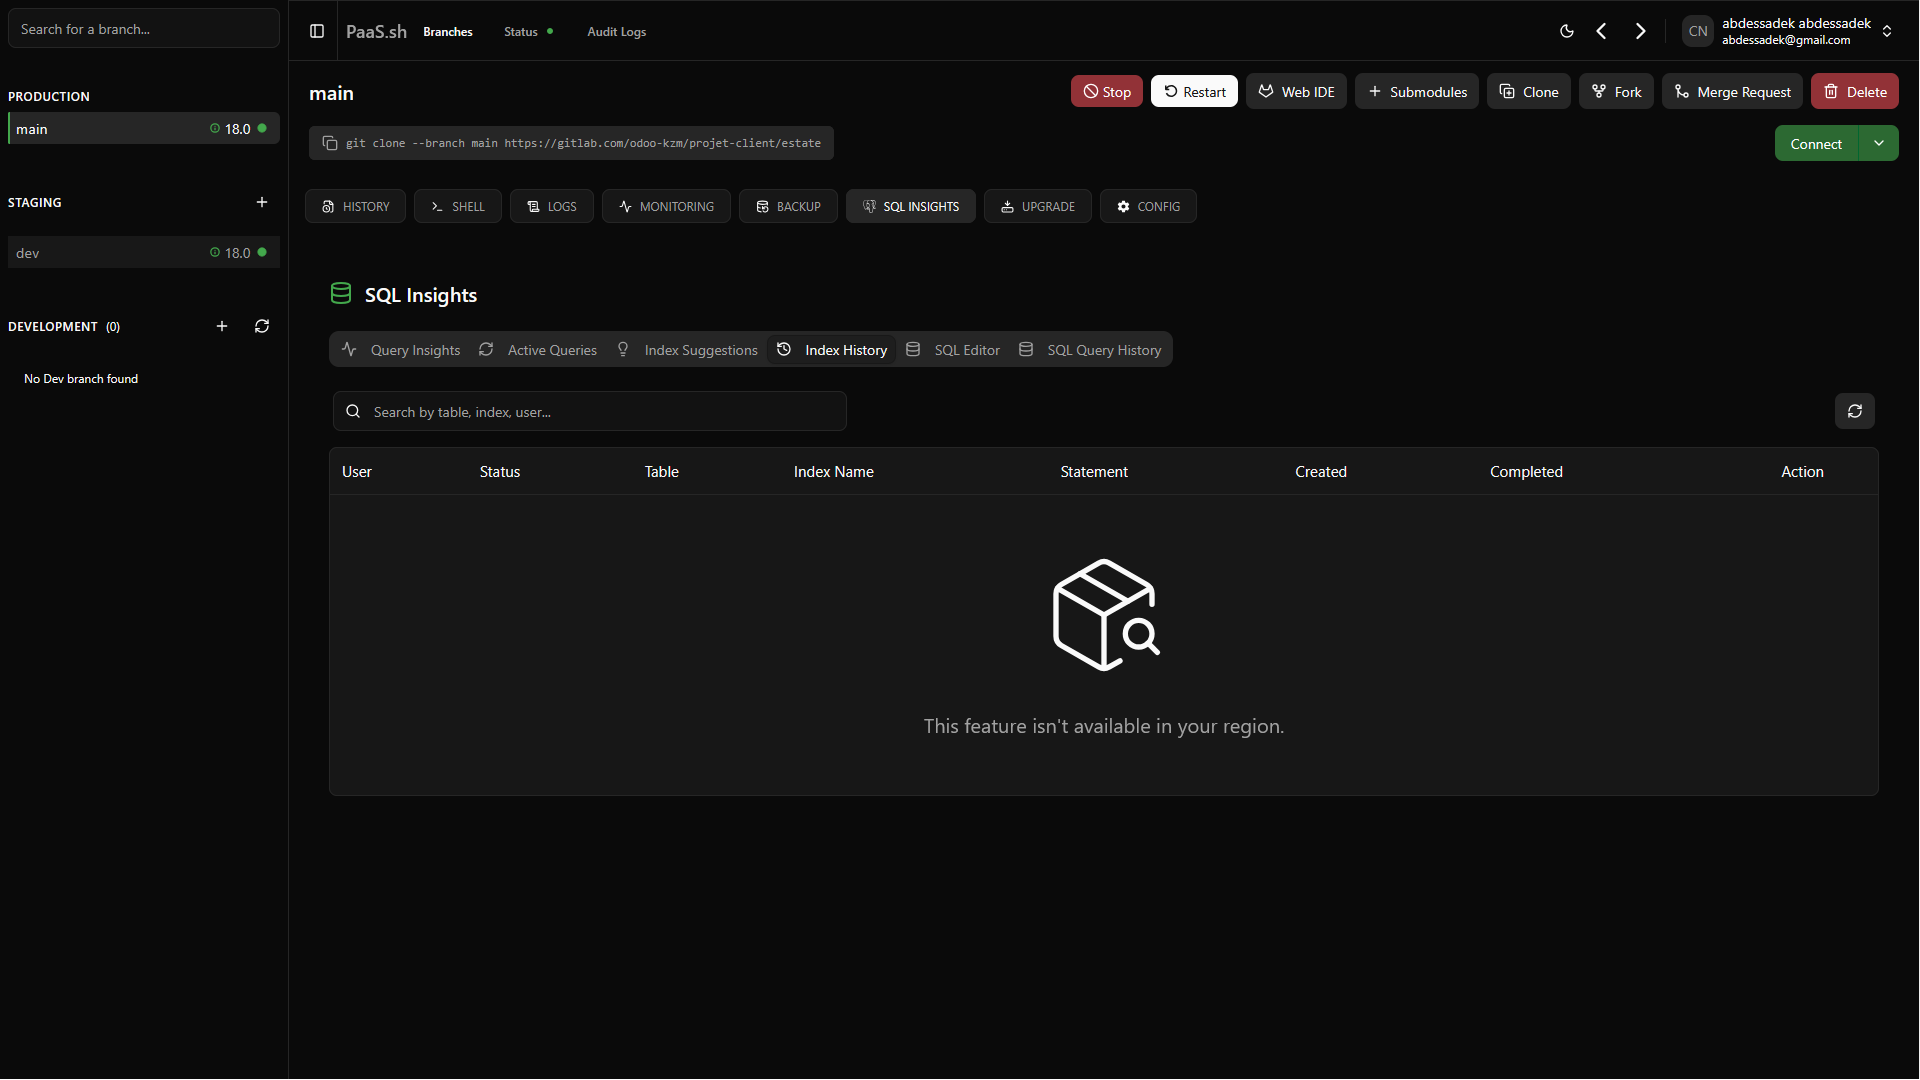
Index History (GCP Only)
To keep track of your database's structural evolution, Index History provides a detailed audit log. It tracks which indexes have been applied, modified, or removed over time.
SQL Editor (All Providers)
Now you are able to run queries all in one place. The SQL Editor allows you to write and test PostgreSQL queries securely. You have two distinct execution options:
- Execute: Runs the query but keeps the transaction pending (uncommitted).
- Execute & Commit: Runs the query and permanently applies the changes.
SQL History (All Providers)
Every query that gets executed in the SQL Editor will be stored in the SQL History along with its status. From here, you can commit pending queries. In case of a conflict, you will be redirected back to the SQL Editor to resolve it. You can also easily rollback your pending queries to undo uncommitted changes.